DevOps Research and Assessment (DORA) publishes a set of software delivery measures. Deployment frequency counts deployments that reached production, per unit of time. Lead time for changes is the median from a commit until the production deployment. Change failure rate is the share of those deployments that degrade the service and need remediation. Failed deployment recovery time is the median time to restore service after one of those deployments. Mean time to restore is the mean from a failure until the service is restored, whatever the cause. The abbreviation MTTR also stands for mean time to repair, mean time to resolve, and mean time to recover, so it is not a synonym of that mean. Mean time to acknowledge is the mean from when an alert is raised until a person accepts it.
Delivery measures, and a mean with four names
Fictional Lantern Works wants the DORA numbers beside MTTR. DORA's current software delivery set has five metrics. Throughput is deployment frequency, change lead time, and failed deployment recovery time. Instability is change failure rate and, since 2024, deployment rework rate. Before rework rate, the set was those other four, often called the four keys. Rework rate is the proportion of deployments that are unplanned and happen because of a production incident, including unplanned work to fix defects. It is not the change failure rate, and this graph does not record it. The Information Technology Infrastructure Library (ITIL) calls mean time to restore mean time to restore service (MTRS). The figures below are invented, not a benchmark.
How often deployments reach production
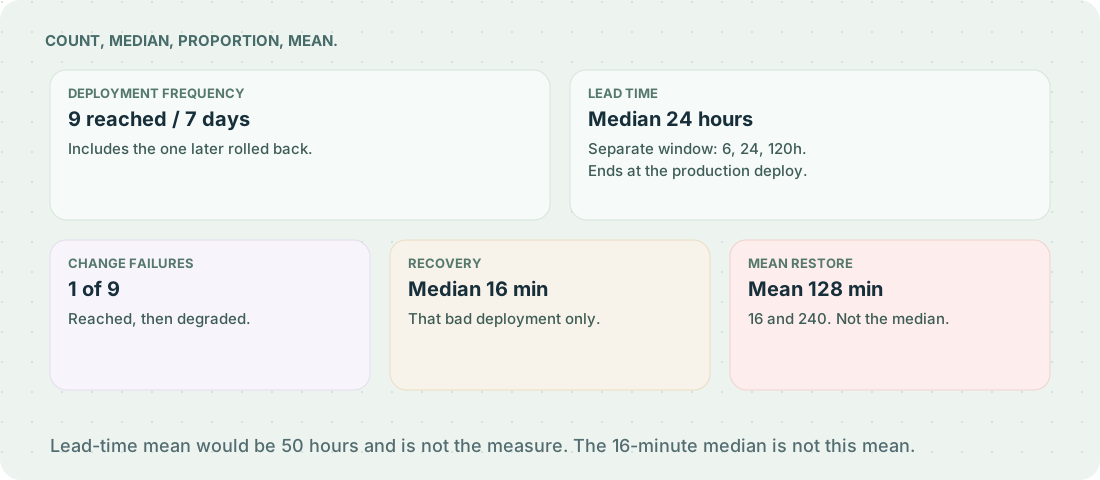
The count includes deployments that reached production and were later remediated. One that never reaches production is excluded. In the invented week, 9 reach production across 7 days, and 1 is later rolled back. A tenth never arrives. The deployment outcome of one deployment is not this rate. The count is of deployments, not releases. Release vs deployment is that split. Turning a feature flag on, with no separate deployment, counts when the team treats that release as the production release, and is not counted again when it is the same event as a deployment.
From the commit to the production deployment
The clock ends at the production deployment, not when a feature flag later exposes the change. Over a window the summary is the median, which is how Four Keys summarizes the durations. DORA's survey asks for the typical time. A mean is not this measure.
Three changes in a separate window took 6, 24, and 120 hours. The median of those three, 24 hours, is the lead time for that window. The mean, 50 hours, is not. That window is not the nine production deployments, so nine is not the count behind this median. The tax-line flag can still be off after a deployment, and the lead time has already ended. Cycle time starts when work starts, not at the commit. A wait from a customer request until delivery is sometimes called lead time too. This measure is only commit to production deployment.
What share degrade the service
The proportion uses production deployments, including releases to users counted as deployments, that degrade the service and need remediation such as a hotfix, a rollback, or a fix forward. A bug found before production is outside it. So is an incident a deployment did not cause, and a deployment that never reached production.
Of the 9 that reached production, 1 degraded the service and was rolled back. The change failure is that deployment. The rollback in this example re-points production at the previous build and is not recorded as another deployment, so it is outside the 9 and it is not a rework deployment. Rework would be a later unplanned deployment made because of the incident. The rate is 1/9. The one that never arrived is in neither count. Frequency's numerator is those same 9, so the degraded deployment is in both measures.
Recovery from that deployment, as a median
The duration starts when a deployment, or a release to users, degrades the service and needs intervention. Until 2023 DORA asked for time to restore service after any user-impacting incident, mixing change-caused failures with failures from elsewhere. That older question is not this metric. The summary is the median. The survey asks for the typical time, not a mean.
That deployment degraded the service immediately, and the service met its success criterion again 16 minutes later, so the median is 16 minutes. The clock starts at the deployment and ends when the service is restored, not when an alert is acknowledged and not when the incident record is closed. This rollback is not the afternoon restored by turning the tax rule off. The unrelated outage below is excluded.
Mean time to restore, and mean time to acknowledge
The mean is arithmetic, over failures in the window. The failure instant is incident failure at when it is known. Restored is incident restored at. Resolved, on the record, can differ from restored, on the service. The degrading deployment's incident opened four minutes after the deployment, so a clock from the opened time would read 12 minutes and would not be this measure. Because that deployment degraded the service immediately, the failure instant and the deployment are the same moment for this one failure. The mean still averages every failure in the window, not only failed deployments.
The same week had an unrelated outage of 240 minutes that a deployment did not cause. The mean of 16 and 240 is 128 minutes. That mean covers both failures. It is not the 16-minute median.
The invented alert was acknowledged 4 minutes after alert raised at, so that window's mean time to acknowledge is 4 minutes. Acknowledgement ends at alert acknowledged at. It is not restoration of an incident, and not one of DORA's software delivery metrics. Level 1 (L1) vs level 2 (L2) vs level 3 (L3) support is who accepts the alert.
Velocity, story points in one sprint, is not a DORA measure. Epic vs user story vs task keeps that sum with the sprint.
| Measure | Summary | Invented figures |
|---|---|---|
| Deployment frequency | Deployments that reached production, per unit of time | One week: 9 reached across 7 days, including the one later rolled back |
| Lead time for changes | Median from commit until the production deployment | Separate window: 6h, 24h, 120h → median 24h, not the 50h mean |
| Change failure rate | Reached production, degraded the service, and needed remediation, over those that reached | That week: 1/9. The rollback is not a second deployment, and the one that never arrived is in neither count |
| Failed deployment recovery time | Median from the degrading deployment until the service is restored | 16 minutes from that deployment |
| Mean time to restore | Mean from failure until restored, whatever the cause | 16 and 240 minutes → 128 minutes. MTTR is not this name |
| Mean time to acknowledge | Mean from alert raised until a person accepts it | 4 minutes for the one alert |
State the window beside every figure. A deployment that reached production and then degraded sits in both the frequency and the change failure rate.