Population counts the people living in a place at a stated time. A useful answer is not just “5 million.” It is “5 million residents, in this country, in this year, according to this source.” The footnote is part of the number.
Read the map without falling into it
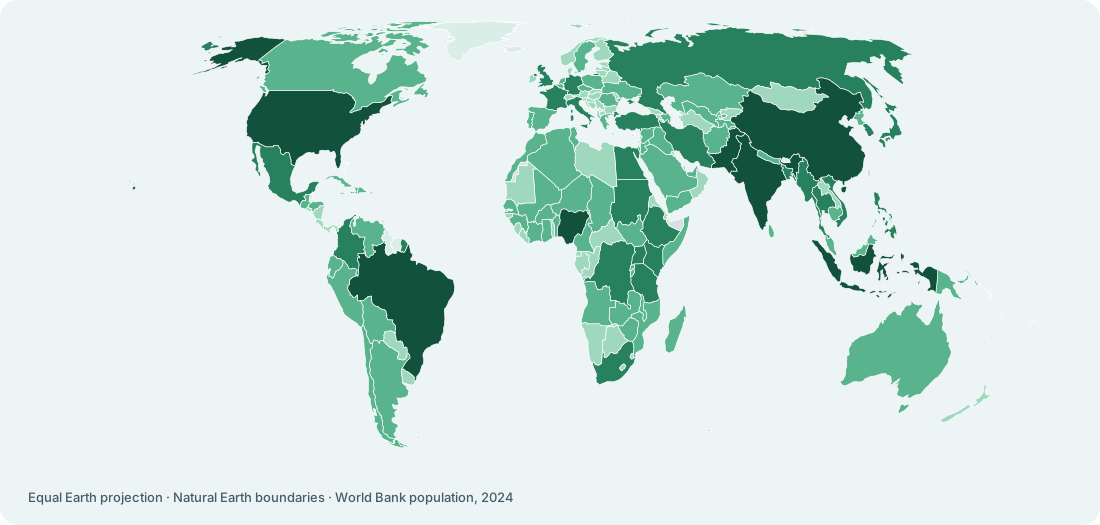
The map above colours countries by their total number of residents in 2024. Darker means more people. It does not show population density: a large, lightly populated country can cover a lot of ink without containing many people. Geography has excellent screen presence.
The World Bank observations are a fixed 2024 snapshot, retrieved on 25 October 2026. They are separate from the population snapshot described by the Chinook graph. The map uses bands rather than a linear colour scale so both small and very large populations remain visible. Grey means no matched observation, never zero. Open the table below the map for exact values.
Three things that belong with every count
- Place: which country, territory, or other boundary does the count describe?
- Time: a census-day count and a mid-year estimate can differ even in the same year.
- Source and method: residents, citizens, visitors, and customers are different populations.
People are born, die, and move. Boundaries and estimation methods can change too. Keep the year and source beside the count instead of treating them as optional decoration.
Why adding populations needs care
MeaningGraph's core population measure sets aggregation to none. A national count is a stated value; the concept does not assume you can obtain it by adding arbitrary rows.
Add a city's population to its country's and you count the city twice. Add overlapping regions and you count the overlap twice. A sum is useful only when the places do not overlap and the counts use compatible dates and definitions.
Made-up example: 100 residents in Place A plus 2,000 in non-overlapping Place B gives 2,100 residents. The average, 1,050, is not the combined population.
A missing count stays missing. Replacing it with zero creates a divide-by-zero problem; replacing it with a neighbour's count creates a fictional result with suspiciously tidy formatting.
From a count to a fair comparison
Per capita divides a total by the population of the same place. A sales total grouped by billing country needs the population of that billing country, not the country where goods were delivered.
The per-capita guide shows two maps of the same invented sales. Their colours change when population enters the calculation. The denominator does real work.
Where the count lives in MeaningGraph
Core population is a measure of country, with unit people and a formula describing a count of residents in a stated year. The core definition does not contain a table of headcounts. A dataset extends the concept and supplies the source, observation year, and binding.
Chinook's population concept says “Not in Chinook.” Its denominator comes from the World Bank's Population, total series, SP.POP.TOTL, rather than from the music-store tables. The graph's source note describes a 2025 snapshot at DataTug Chinook demo commit d2fc437. That source note and the 2024 map above describe different snapshots; do not silently interchange them.
Country names on invoices are matched to shared country values, then population is joined through the ISO alpha-2 code. A missing population excludes the country from the per-capita result.
Keep exploring
Follow the country identity guide to understand the join, the billing-country guide to choose the right geography, or the Chinook worked example to connect population with revenue.