Per capita means for each person. Divide a total by the population of the same place. Multiply by a scale, such as 1,000 or 1,000,000, when that makes the result easier to read.
Per-capita measure = total ÷ population × scale
A large country often has a large total simply because it has more people. Per capita asks another question: how much is there relative to the number of residents? The denominator gets a vote.
What the two maps reveal
Imagine a bookshop with sales in six countries. We invented the sales amounts and paired them with real World Bank 2024 populations. This is a teaching example, not a report about any bookshop, national market, or Chinook database.
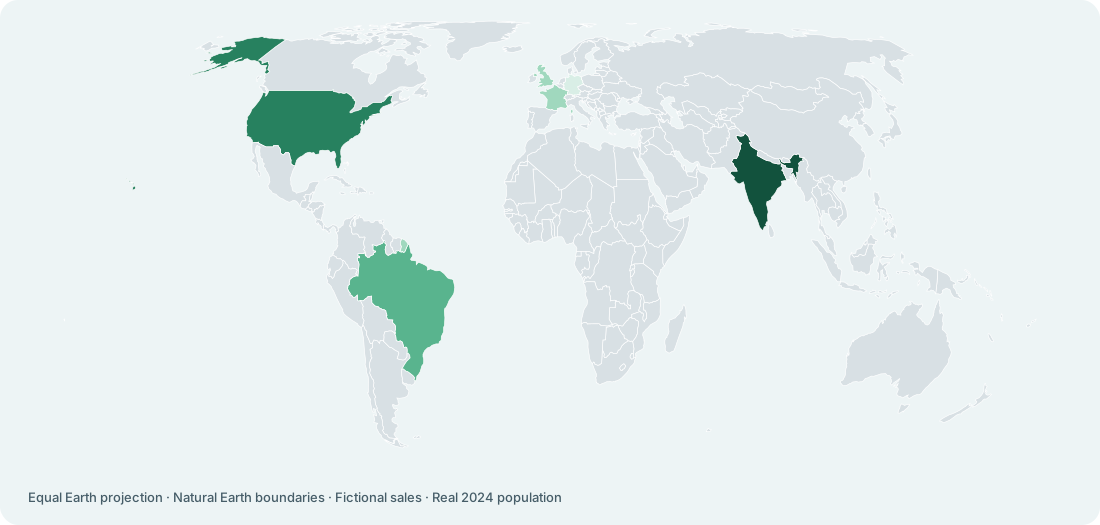
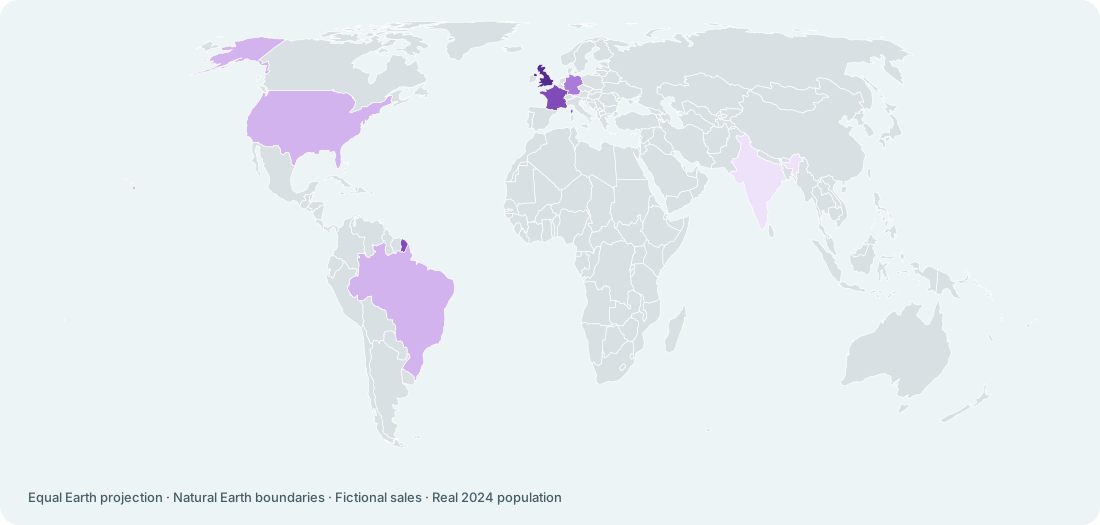
India has the largest invented sales total, $150,000. The United Kingdom has $60,000. Divide each amount by its population and scale per million residents: the United Kingdom is about $866 per million, while India is about $103. The ranking reverses because the populations differ enormously.
Same sales. Different map.
India leads the invented sales total. The United Kingdom leads after dividing by population. Neither map is wrong; they answer different questions.
01 / Total sales · USD
02 / Sales per million residents · USD
See all six countries and the arithmetic
| Country | Sales (USD, invented) | Population (2024) | USD / million people |
|---|---|---|---|
| United Kingdom | $60,000 | 69,281,000 | $866.04 |
| France | $50,000 | 68,551,653 | $729.38 |
| Germany | $40,000 | 83,516,593 | $478.95 |
| Brazil | $75,000 | 211,998,573 | $353.78 |
| United States | $120,000 | 340,003,797 | $352.94 |
| India | $150,000 | 1,450,935,791 | $103.38 |
World Bank SP.POP.TOTL, 2024 (CC BY 4.0), retrieved 25 October 2026. Boundaries: Natural Earth (public domain); Equal Earth projection. Generalised boundaries; small territories may not appear. Sales amounts are editorial examples.
Choose the unit before reading the number
A rate without its scale is an invitation to a very confident mistake. “50 per person” and “50 per million people” differ by a factor of a million.
- Per person: total ÷ population.
- Per 1,000 people: total ÷ population × 1,000.
- Per million people: total ÷ population × 1,000,000.
Revenue measured in USD becomes USD per person, or USD per million people. It is a new measure with a new unit. Scaling changes the size of every value equally, so it does not change their ranking.
Combine the ingredients, not the ratios
Suppose Place A has 50 units of sales and 1 million residents. Place B has 200 units and 50 million residents. These numbers are made up.
Their sales per million people are 50 and 4. Combined, the places have 250 units of sales and 51 million residents, giving 250 ÷ 51 ≈ 4.90 units per million people.
Adding the ratios gives 54, which is wrong for the combined place. Taking their simple average gives 27, which treats the two populations as equal. Add compatible totals and non-overlapping populations, then divide once. MeaningGraph therefore sets aggregation of the ratio to none.
The three checks that prevent bad comparisons
- Same geography: the total and population must describe the same place. Billing and shipping countries can differ.
- Stated time: give the sales period and the population observation year. A multi-year sales total divided by one year's population is not automatically an annual rate.
- Valid denominator: a missing or zero population cannot produce a usable rate. Very small denominators can produce unstable-looking comparisons.
Per capita also does not mean per customer. Residents who never visited the shop remain in the denominator. A high result does not prove that the typical resident bought anything.
How the concept becomes a calculation
The core concept names the population input and the scale. A dataset extends it with a specific numerator, geography, and unit. Chinook's music sales per million people divides its music sales by population for each billing country, then multiplies by 1,000,000.
The Chinook guide follows the calculation from invoice to ratio. Population explains the headcount. Country identity explains how names and codes meet at the same place.